

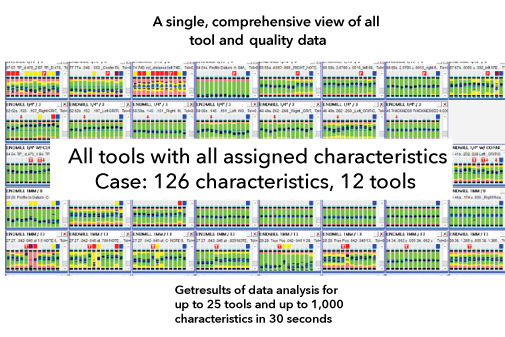
A single view of process quality
- MICRONITE introduces combined powerful, predictive analytics with visual data exploration in a single operational environment
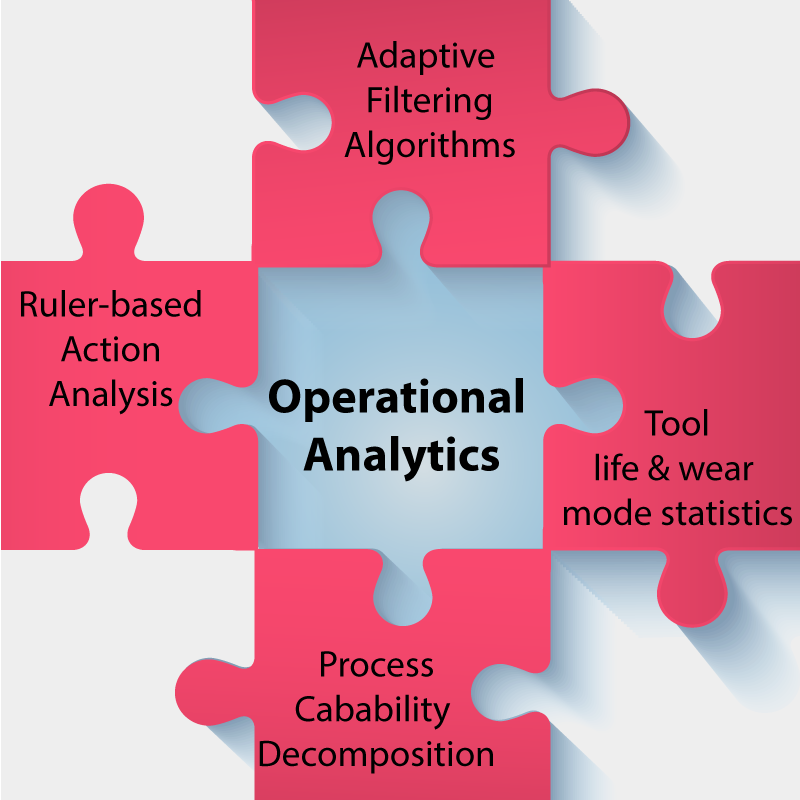
- Visual analytics include: (1) tool-and-feature dynamic summary chart, (2) drawing-based tool-and-quality graphics, and (3) total quality assessment throughout shifts and lots
- Operational tool-and-feature graphics help visualize the effects of process actions on performance
- In-screen data filtering helps engineers focus on high-value tool control tasks instead of spending time observation of all operational data
- Visual analytics are used for concurrent validation of NC-code and tool design, and optimization of inspection schemes
MICRONITE delivers multi-source data representation and predictive analytical techniques that address the issues high-tech manufacturers face, including (1) zero-defect control of close-tolerance machining, (2) early detection of engineering problems, (3) improvement of production system effectiveness. Analysis of CMM, Vision System, and gaging data by MICRONITE enhances quality management and minimize losses.
Intelligent cross-connections
The creation of a paperless data structure with intelligent interconnections between quality, process, and production control has been one of the main objectives of MICRONITE’s development. MICRONITE’s methodology introduces the infrastructure for a new way of production management that’s more consistent, collaborative, and productive than ever before.
At every point of production, there are slowdowns caused by difficulties of product launch, process failures, tool breakages, operator mistakes, etc. Viewing the entire operation with MICRONITE’s visual machining analytics and predictive decisions is one unique feature that provides a clear guide to in-process control and engineering corrective actions. MICRONITE fits smoothly into an increasingly diversified work culture. The MICRONITE system is also taking a leap from simple data storage to user-responsive data analysis and cross-functional reporting.
Automated data analysis with adaptive filtering algorithms
View tool-critical characteristics
Assignment: find Top-Focus tools with KCC and critical characteristics
- Nonconforming found
- Accelerated tool wear rate
- Excessive sample variation
- High process instability
- Difficult-to-control process
Current case: 6 tools, 15 characteristics
View a State of process control
Assignment: find TOP focus and Alert tools with all characteristics
- Moderate controllable tool wear rate
- Sample variation 20-40% of tolerance
- Acceptable process shift
- Acceptable process stability
- Easy-to-control process
Current case: 9 tools, 38 characteristics
View a State of Six Sigma
Assignment: find Six Sigma characteristics for reduction of CMM program
- Steady-state stable process
- Negligible tool wear rate
- Zero probability of defects
- No actions are needed
Current case: 72 Six Sigma characteristics